 Get in Touch
Get a Quote

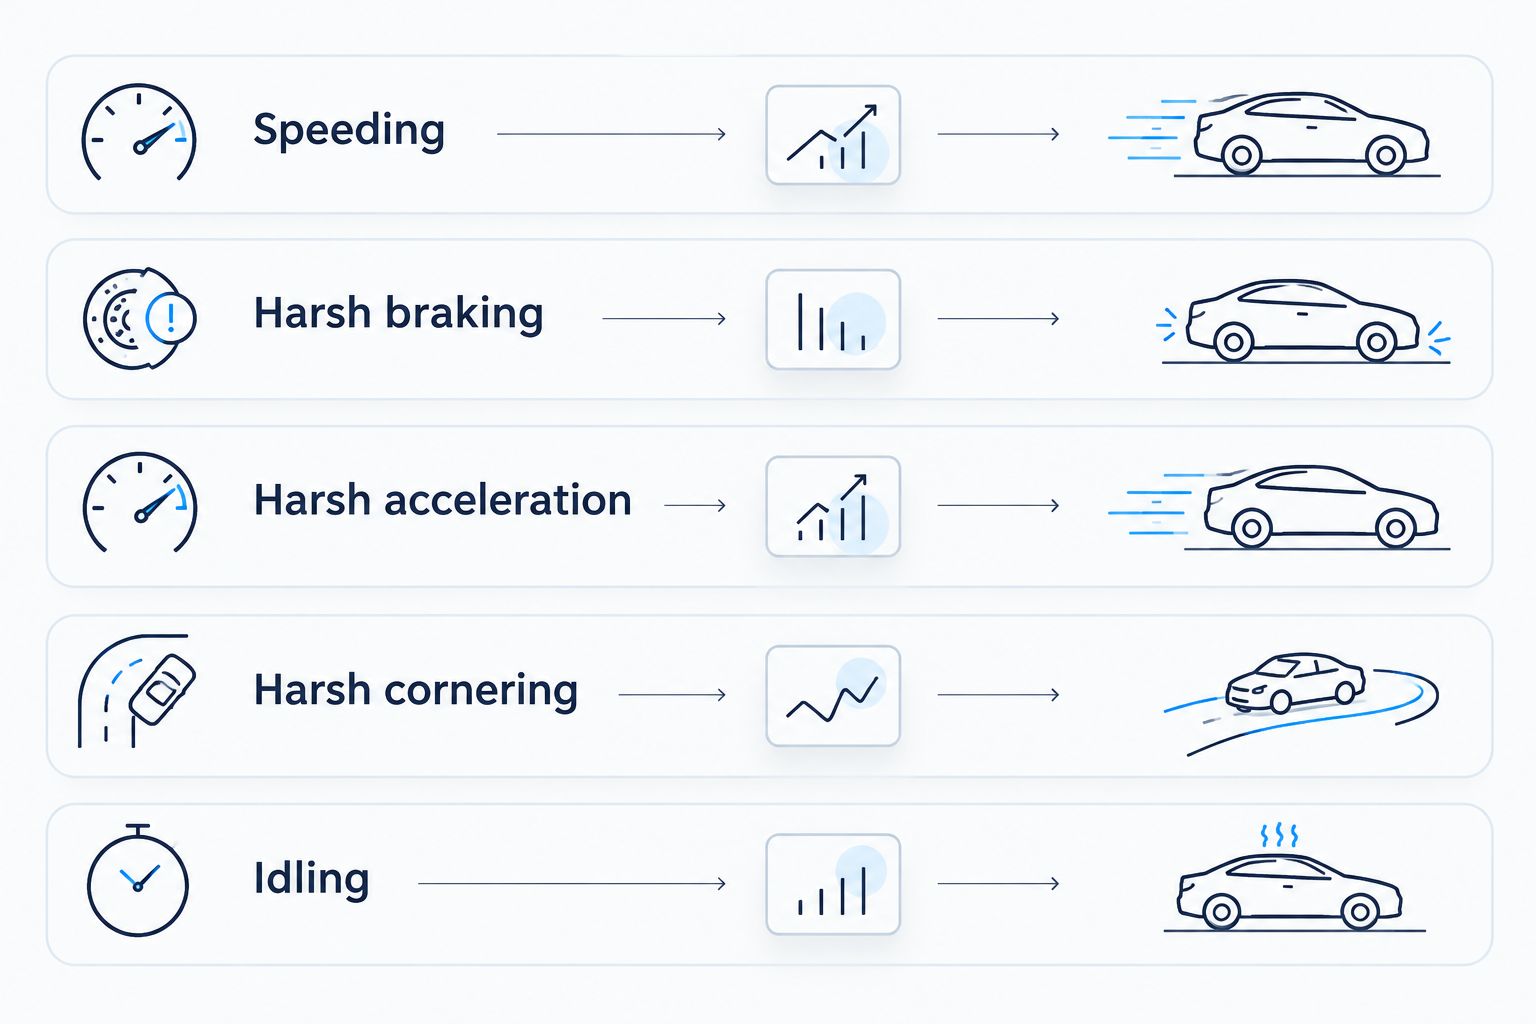
Driver behaviour monitoring works when you track a small set of measures that managers can act on. Five cover most of what matters on UK roads in 2026: speeding, harsh braking, harsh acceleration, harsh cornering and idling.
- Driver behaviour monitoring is most useful when it tracks five measures: speeding, harsh braking, harsh acceleration, harsh cornering and idling.
- Speeding comes first because FleetTracker supports speeding alerts and the link to road risk is direct.
- Confirm which measures are live on your account before you write them into a driver policy.
- Use SmartCam 4G when you also need recorded video evidence behind a Driver Score.
- Tell drivers what you measure and why before the first report is run.
Why these five measures matter in 2026
Most fleets do not have a data shortage. They have too many reports and no agreed list of what counts as a problem. Five measures give a fleet manager a short, defensible list.
Each one maps to a cost or risk you already carry: road safety, vehicle wear, fuel use, and the time spent explaining incidents afterwards. None of them proves a driver is at fault on its own. Together they show patterns.
This guide is for fleet managers running cars, vans or HGVs. It explains what each measure shows, what to do with it and where it can mislead you. Crystal Ball supports this through FleetTracker for tracking and reporting, and SmartCam 4G where video telematics is needed.
A note on product scope. These five KPIs are exactly what the Driver Behaviour add-on for FleetTracker scores: speeding, harsh acceleration, harsh braking, cornering and idling. It turns them into driver scores and a driver league table, with an in-cab audible buzzer, reports on the desktop portal, and the CB Driver app where drivers can check their own score.
The five measures at a glance
| Measure | What it shows | Main risk it points to | Best first action |
|---|---|---|---|
| Speeding | Time or events above the speed limit | Collision risk, penalty points | Alert, then a conversation |
| Harsh braking | Sudden deceleration events | Tailgating, poor hazard anticipation | Review the route and the context |
| Harsh acceleration | Rapid speed increases | Fuel use, tyre and drivetrain wear | Coach on smooth starts |
| Harsh cornering | Sharp lateral force in turns | Load shift, rollover risk, tyre wear | Check roundabouts and junctions |
| Idling | Engine running while stationary | Wasted fuel, emissions, wear | Set a site rule |
The order below follows risk, not convenience. Start at the top and work down.
1. Speeding: the measure with the clearest link to risk
Speeding is the first measure to put in place. It ties to the most serious outcomes: collisions, penalty points and the driver’s licence.
FleetTracker supports speeding alerts, so a manager is told when a vehicle exceeds a set threshold rather than finding out in a monthly report. Alerts work best when the threshold is clear and applied to everyone.
What to look at:
- How often each driver breaches the limit, not a single event.
- Where it happens. A repeat location may point to a route problem, not a driver problem.
- Whether breaches cluster at the end of the day or on tight schedules.
Where it can mislead: speed data is only as good as the limit data behind it. A temporary limit or a recent change can produce false flags. Treat the first alert as a prompt to ask a question.
If penalty points are your main worry, read how fleet tracking can help reduce speeding tickets. It covers how alert data supports the right conversation with a driver.
Where to start. Set the alert, communicate the rule, review weekly.
2. Harsh braking: the earliest sign of following too closely
Harsh braking events show sudden deceleration. A few are normal in busy traffic. A pattern is not.
Repeated hard stops often point to tailgating, distraction or poor anticipation of hazards. They also show up in brake pad and tyre wear, which turns a behaviour issue into a maintenance cost.
What to look at:
- Events per driver across comparable routes, not raw totals. A city courier will brake more than a motorway driver.
- Time of day and location.
- Whether the same driver appears across several weeks.
Where it can mislead: a harsh braking event can be a driver avoiding a collision. That is good driving. Without context, you could coach the wrong person. Where you have SmartCam 4G, recorded footage accessed on demand through the customer portal gives you that context. Footage is not live-streamed, so you retrieve it after the event.
How to use it. Apply a rule that no one is coached on a single event.
3. Harsh acceleration: where fuel and wear quietly build up
Hard acceleration is less dramatic than speeding but it costs money steadily. It raises fuel use and puts load on the drivetrain and tyres.
It also tends to be easy to change. Drivers rarely realise they accelerate hard, and a short conversation can shift habits faster than a policy document.
What to look at:
- Drivers with a high event count on flat, low-traffic routes. Those are the clearest cases.
- Vehicle type. A loaded van behaves differently from an empty one.
- Whether the pattern improves after coaching.
Acceleration data is a coaching tool more than a disciplinary one. If you treat it as a penalty, drivers will argue about the threshold instead of changing the habit.
For the fuel side, how to reduce fuel costs with fleet tracking data sets out which reports to use alongside behaviour data. Fuel savings are not guaranteed, so judge results against your own baseline.
How to use it. It pays off most where fuel is a major cost line. Otherwise leave it until speeding and braking are under control.
4. Harsh cornering: the measure that matters most for heavier vehicles
Harsh cornering flags sharp lateral force in turns. For cars, it is a comfort and wear issue. For vans carrying loads and for HGVs, it carries a more serious risk: load shift and, in the worst case, rollover.
Roundabouts, slip roads and tight depot entrances are the usual hotspots. The same location appearing repeatedly across several drivers tells you the junction is the issue, not the people.
What to look at:
- Repeat locations across drivers.
- Events on loaded versus unloaded journeys, if you can separate them.
- Heavy-vehicle drivers first.
Where it can mislead: sensor mounting and vehicle type affect readings. Compare drivers in similar vehicles, not across the whole fleet.
How to use it. It matters most for HGV and loaded-van fleets. Small car fleets with low exposure can come to it later.
5. Idling: the quiet cost no one notices
Idling is a different kind of measure. It is less about safety and more about waste. An engine running in a stationary vehicle burns fuel and adds wear without moving anyone anywhere.
It is also the easiest measure to turn into a site rule. Drivers understand a rule like “switch off if you are waiting more than a few minutes” far more readily than they understand an abstract score. Set your own limit and apply it consistently.
What to look at:
- Idling at customer sites and depots, where a rule can fix it.
- Idling at the start of the day, often warming the cab.
- Vehicles that idle far more than others on the same job.
Some idling is legitimate: refrigeration, traffic, power take-off and cab heating in severe weather. Agree the exceptions up front so the report stays credible. For a full approach, see how to reduce fleet idling time with telematics.
How to use it. It is a low-friction first win.
Turning five measures into a score
A single score makes it easy to compare drivers. It also hides what is behind it. Two drivers can share a score for opposite reasons: one speeds, one idles.
On FleetTracker, the Driver Behaviour add-on combines the five KPIs into one driver score and ranks drivers in a league table, with reports on the desktop portal. SmartCam 4G adds driver scorecards backed by footage. Always look at the components before you act on the headline number.
The SmartCam driver scores and league tables guide explains how those scores are presented. Use league tables carefully. Publicly ranking drivers can damage trust if the data is not yet accepted as fair.
Which product covers which measure
Keep the boundary clear. It stops you promising drivers something the system does not do.
- FleetTracker: live tracking, journey playback, geofences, alarms and alerts (including an idling allowance), timesheets and scheduled email reports. The Driver Behaviour add-on scores the five KPIs above, and the Automatic Driver Recognition (ADR) add-on (Dallas keys) shows who was driving. It does not provide camera footage.
- SmartCam 4G: a forward-facing camera with optional internal, rear and side cameras, footage retrieved on demand through the portal or app, automatic upload of incident footage on harsh braking, collision or speed events, and driver scorecards.
If you only need to know where vehicles are and how fast they travel, FleetTracker is the simpler answer. Add SmartCam 4G when you need footage to back up a behaviour event or to resolve a dispute. Do not recommend the more advanced product when the simpler one answers the need.
For a deeper look at the video side, read the SmartCam driver behaviour monitoring guide.
How to roll this out without losing your drivers
The technology is the easy part. The harder part is how drivers feel about being measured. Handle it in this order:
- Explain the purpose. Safety and fair treatment, not surveillance.
- Publish the measures. Drivers should know the five things you track.
- Set thresholds once. Changing them mid-year destroys credibility.
- Coach before you discipline. Use the first report as a conversation.
- Review monthly. Look at trends, not single events.
You also have data-protection duties when monitoring staff. The ICO is the authority on worker monitoring, so check its guidance and document your reasons. For the employee communication side, see how to introduce GPS vehicle tracking to employees.
What the data cannot tell you
Behaviour data shows what a vehicle did. It does not show why. A harsh brake can be a near miss avoided. A speeding alert can be a wrong limit. An idling spike can be a legitimate delivery wait.
That is why the best programmes pair data with a human review. Crystal Ball is a family-run UK business with in-house development and human support, and that shapes how it recommends fleets use these tools: as a prompt for a fair conversation.
No behaviour measure guarantees fewer accidents or lower insurance premiums. Judge the result by your own incident, fuel and maintenance records over time. For the wider view, how to cut fleet accident rates with driver behaviour monitoring covers how to measure the effect against your own baseline.
Which measure should you start with?
Start with speeding. For loaded vans and HGVs, harsh cornering matters most. For fuel-heavy fleets, harsh acceleration and idling. For coaching conversations, harsh braking.
If you track only one measure in 2026, make it speeding. Add the others one at a time as drivers get used to being measured.
FAQ
What is driver behaviour monitoring?
Driver behaviour monitoring uses vehicle data to show how a vehicle is driven, such as speeding, harsh braking, harsh acceleration, harsh cornering and idling. Managers use it to coach drivers and spot risk patterns.
Does FleetTracker include camera footage?
No. FleetTracker does not provide camera footage, video telematics or digital vehicle checks. SmartCam 4G adds a forward-facing camera and recorded footage accessed on demand through the customer portal.
Does FleetTracker send speeding alerts?
Yes, FleetTracker supports speeding alerts. Check the current product page for the exact alert options available on your account.
How do you get SmartCam 4G footage?
SmartCam 4G stores footage in the cloud. A manager retrieves clips on demand through the portal or app, and incident footage uploads automatically when a G-sensor event such as harsh braking or a collision is detected.
Which driver behaviour measure should I track first?
Start with speeding, because it has the clearest link to collision risk and penalty points. Add braking, acceleration, cornering and idling once drivers accept the process.
Will driver behaviour monitoring lower my insurance premiums?
It can support a conversation with your insurer, but no result is guaranteed. Premiums depend on your insurer, your claims history and the evidence you can show.
Do I need to tell drivers they are being monitored?
Yes. Tell drivers what you measure and why before you start. The ICO publishes guidance on monitoring workers and the data protection duties that apply.
One last thing
The most useful report is rarely the one with the most columns. Pick one driver, one measure and one conversation this month. Repeat it next month. Fleets that build the habit of a fair, regular review get more from the same data than those that buy more reports.
If you want to see the five scores and the league table in the portal for your own fleet, Request a Demo and ask Crystal Ball to walk through the reports.
Explore the relevant Crystal Ball solution

Crystal Ball FleetTracker
Live vehicle location, journey history, geofences, supported alerts, mileage, utilisation and fleet records.